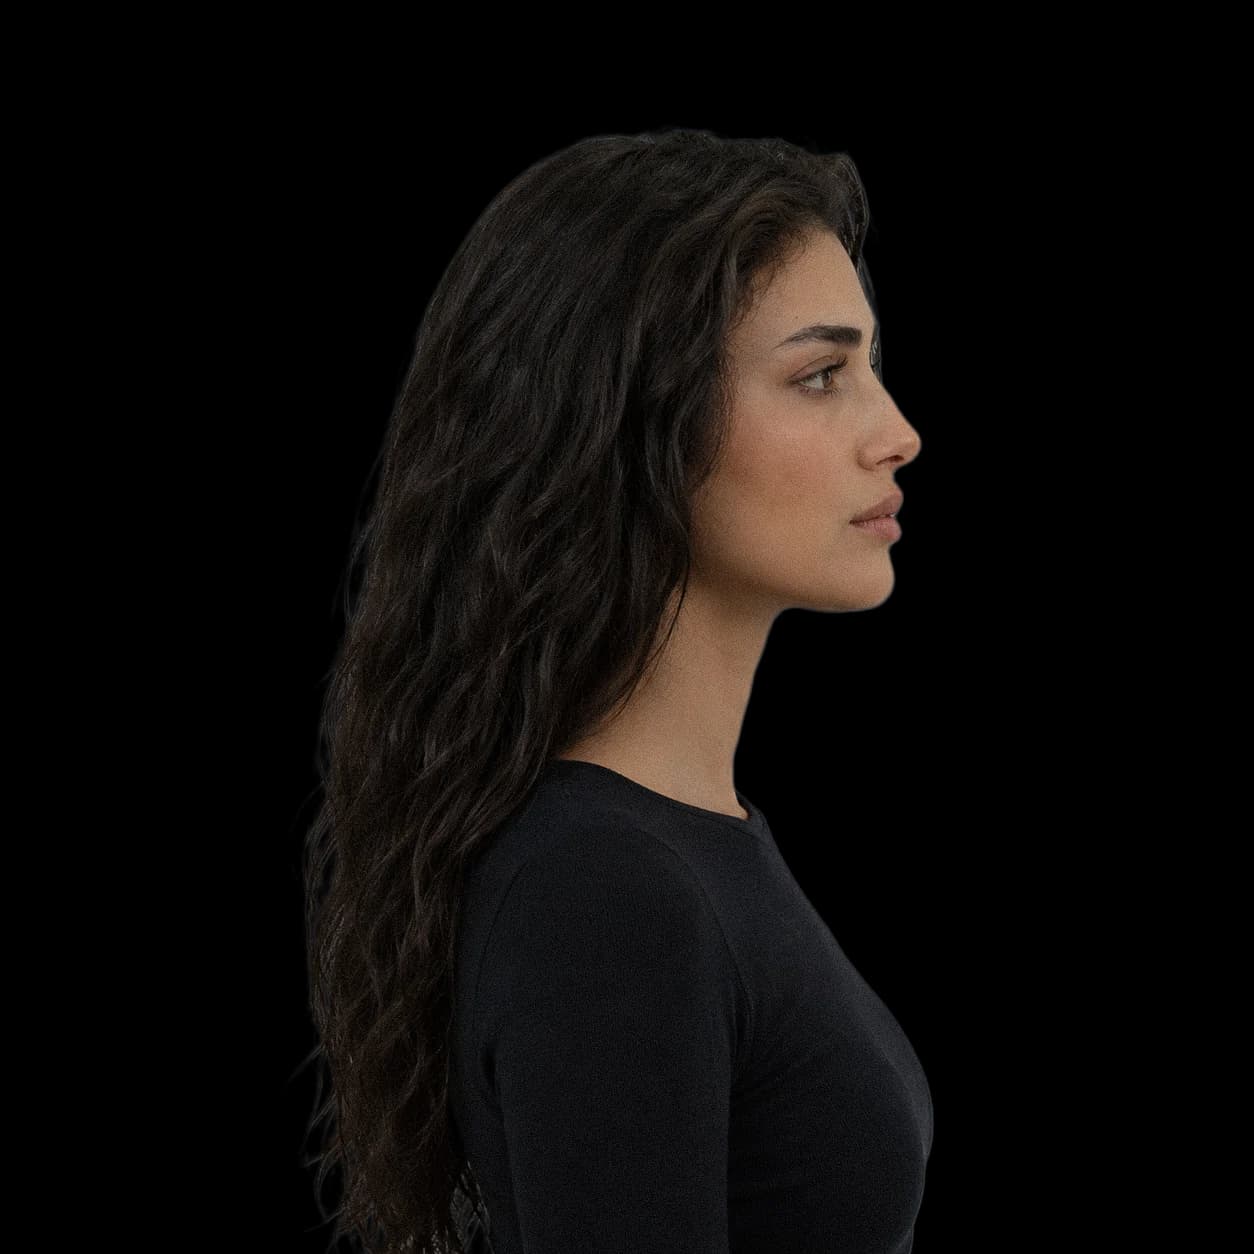
The maxilla is the upper jaw. Its palate is the roof of the mouth and, from the other side, the floor of the nose. That double role is why its width matters beyond the smile. A narrow maxilla narrows the nasal floor above it and the tongue space below it, and the published measurements trace a chain from there: higher nasal resistance, more negative pressure in the throat during sleep, fragmented sleep, lower overnight oxygen, and measurable changes in blood pressure and hormones. This article works through that chain with the physics and biochemistry written out.
Landmarks
- Maxilla
- The paired upper jaw bone. It carries the upper teeth and forms the hard palate, which is also the floor of the nasal cavity.
- Intermolar width
- The distance between the upper first molars, the standard dental-model measure of how wide the arch is at the back.
- Nasal airway resistanceNAR
- Pressure needed to drive a given airflow through the nose, in cmH₂O per litre per second. Higher means more effort per breath.
- Apnoea-hypopnoea indexAHI
- Breathing stops (apnoeas) plus partial reductions (hypopnoeas) per hour of sleep, measured by polysomnography.
- Obstructive sleep apnoeaOSA
- Repeated collapse of the upper airway during sleep, with drops in oxygen and brief arousals from sleep.
What a narrow maxilla is
A narrow maxilla, also called maxillary constriction or transverse maxillary deficiency, is an upper jaw that is small from side to side relative to the face and the lower jaw. On dental models it shows as reduced intercanine, interpremolar and intermolar widths. In the mouth it often shows as a posterior crossbite, where the upper back teeth sit inside the lower ones, and a palate that looks high and narrow because the same vault height is carried over a smaller base.
Because the palate is both the roof of the mouth and the floor of the nose, a narrow maxilla is never only a dental finding. It sets the width of the lower nasal airway and the volume available to the tongue. A wide maxilla does the reverse: a broader nasal floor, more room for the tongue to rest up in the palate, and an upper arch that meets the lower arch across its full width.
What the case-control studies measured
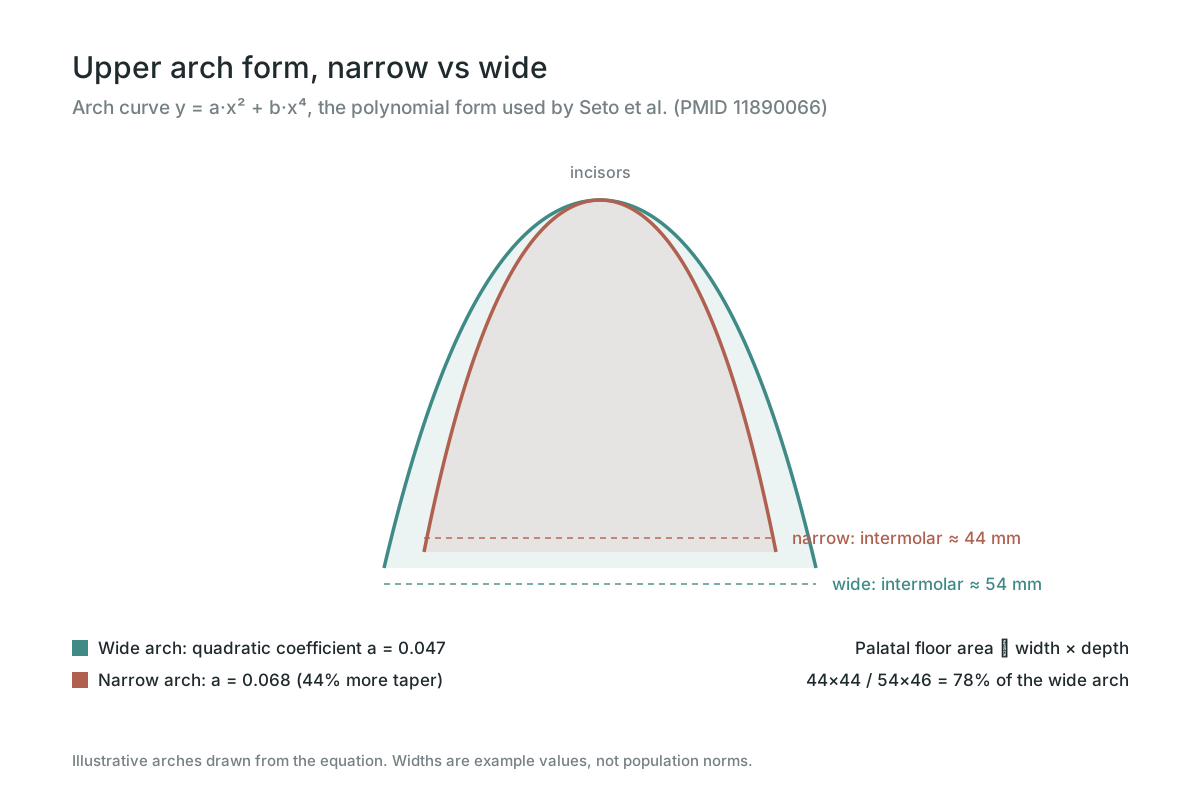
Seto and colleagues compared 40 patients with obstructive sleep apnoea against 21 non-snoring, non-apnoeic controls. The patients had significantly smaller intercanine, interpremolar and intermolar widths, shorter maxillary depth, and a larger quadratic coefficient in the polynomial fitted to their arches, meaning more taper. Half of them had a posterior transverse discrepancy, against one control in twenty. Their maxilla-to-mandible and maxilla-to-face width ratios were also smaller (PMID 11890066).
Johal and Conaghan repeated the comparison with 47 patients and 47 controls. Minimum palatal airway width was significantly reduced in both men and women with sleep apnoea, and palatal height was greater (PMID 15529500). Kushida, Efron and Guilleminault built a screening model from oral cavity measurements, including palatal height and intermolar distances, together with body mass index and neck circumference. In 300 consecutive sleep clinic patients it reached 97.6% sensitivity and 100% specificity for the syndrome (PMID 9341055). The arch dimensions carry real information about the airway.
50% vs 5%
Transverse discrepancy, OSA vs controls
2.66×
Nasal resistance in constricted maxillae
97.6%
Sensitivity of an oral-cavity OSA model
What narrows a maxilla: breathing, habits, diet and load
The maxilla is built by its environment. In Harvold's primate experiments, the only change was silicone plugs in the nose. The monkeys adapted by holding the mouth open, lowering the jaw or pushing the tongue forward, and every experimental animal gradually acquired a facial appearance and dental occlusion different from the controls (PMID 6939331). Mouth breathing alone was enough to reshape the face.
Habits in infancy leave marks that outlast them. In 372 children followed from birth, prolonged pacifier habits changed arch dimensions, and some effects, including posterior crossbite, persisted well beyond the end of the habit (PMID 11997758). Across 41 studies and 27,023 participants, children who were ever breastfed had a third of the odds of malocclusion of those never breastfed (OR 0.34, 95% CI 0.24 to 0.48) (PMID 26140303).
Chewing load is a growth signal. Growing rats fed a soft diet developed less transverse growth of the maxilla and dental arch, with reduced sutural bone apposition, and in humans thicker masseter muscles went with broader maxillary arches (PMID 11803645). Minipigs raised on soft food with the same nutrients, with genetics and breathing controlled, showed markedly different arch narrowness, crowding and facial projection from littermates raised on hard food, and a 25% smaller deep masseter (PMID 9224944). Corruccini described the same transition in human populations: malocclusion rises with urbanisation at a speed proportional to the speed of that change, which points to environmental rather than genetic causes (PMID 6594064). Twin studies do find a heritable share, but genes cannot change within one or two generations; breathing, habits and food can.
Why a small loss of width costs so much airflow
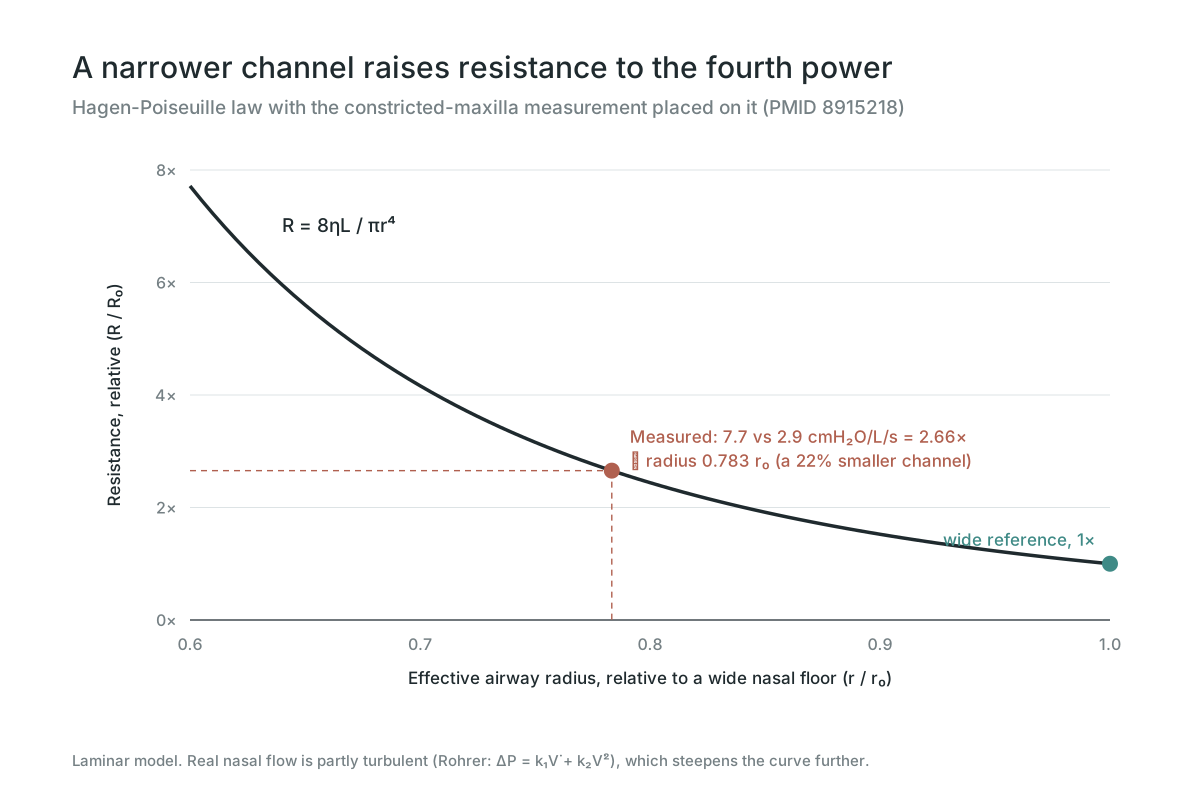
Cistulli and colleagues measured nasal airway resistance by posterior rhinomanometry in people with the markedly constricted maxilla and high palate typical of Marfan syndrome. Mean resistance was 7.7 cmH₂O/L/s against 2.9 in controls, more than twice as high. Two of the lateral maxillary widths correlated inversely with resistance, and the maxillary arch ratios correlated with the apnoea-hypopnoea index (PMID 8915218).
The size of that jump follows from the physics of flow in a tube. The Hagen-Poiseuille law gives resistance as R = 8ηL / πr⁴, where η is air viscosity, L the length of the channel and r its radius. Everything except r is roughly fixed for a given nose, so R/R₀ = (r/r₀)⁻⁴. Solving for the measured ratio: 7.7 / 2.9 = 2.66, and 2.66^(−1/4) = 0.783. A channel whose effective radius is just 22% smaller than normal is enough to explain the entire difference.
Real nasal flow is partly turbulent, which the Rohrer equation captures as ΔP = k₁V̇ + k₂V̇². The second term grows with the square of the flow, so during heavier breathing the penalty for a narrow channel increases further. The laminar curve in Figure 2 is the minimum cost, not the ceiling.
The pressure and the work, per breath and per night
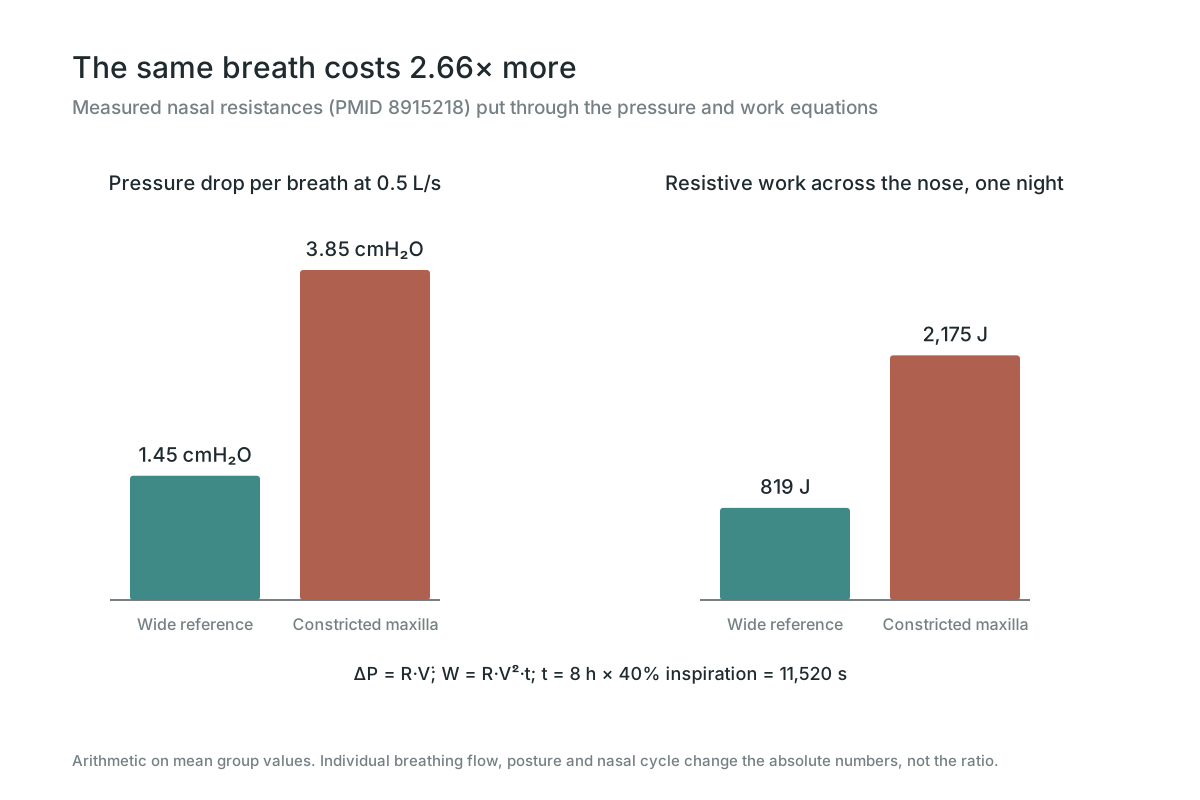
Resistance becomes a pressure through ΔP = R·V̇. At the 0.5 L/s flow the study used, the control nose needs 1.45 cmH₂O to move air and the constricted one needs 3.85 cmH₂O. That extra 2.4 cmH₂O is suction that has to be generated below the nose, which means inside the throat.
Integrated over a night, resistive work is W = R·V̇²·t. With 8 hours of sleep and about 40% of each breath spent inhaling, t is 11,520 seconds. The wide reference comes to roughly 819 J and the constricted one to 2,175 J. At about 14 breaths a minute that is 6,720 breaths a night and about 2.45 million a year, each one 2.66 times as expensive.
The energy is not the problem. The 1,356 J difference is about 0.3 kcal per night. What matters is where the pressure goes, which is the subject of the next section.
How nasal resistance turns into broken sleep
The pharynx has no bone around it. It behaves like a collapsible tube: pressure inside it equals atmospheric pressure minus the pressure lost upstream, P_pharynx = P_atm − R_nasal·V̇. A higher nasal resistance makes the pressure inside the throat more negative on every inhale, and during sleep, when the dilator muscles relax, a more negative pressure pulls the soft walls inward more easily.
Guilleminault described what happens before full apnoea. In people with upper airway resistance syndrome, the peak oesophageal pressure just before an arousal averaged −33 cmH₂O, and sleep was broken by short alpha arousals at a mean of 31 per hour (PMID 8365289). All of them had mildly abnormal upper airway anatomy. At 31 arousals an hour, the longest uninterrupted stretch of sleep averages 60 / 31 ≈ 1.9 minutes, and over 8 hours that is about 248 interruptions. Their mean sleep latency on daytime testing was 5.1 minutes, a level usually seen in pathological sleepiness.
A narrow maxilla also sets the tongue lower. With less palatal volume above it, the tongue rests farther down and back, which takes space from the airway behind it. Mouth breathing then becomes the easier route when the nose is costly, and that brings its own losses, described below.
Oxygen: what the curve says about each event
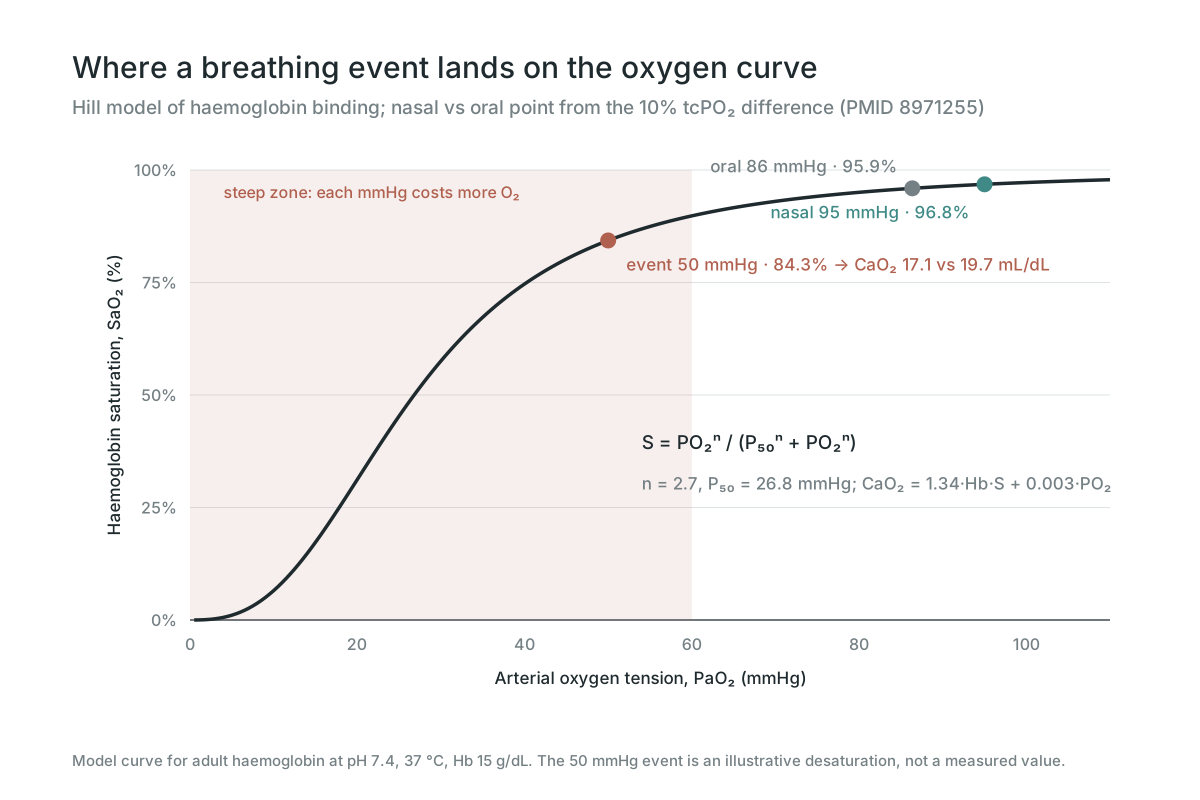
Oxygen binding to haemoglobin follows the Hill equation, S = PO₂ⁿ / (P₅₀ⁿ + PO₂ⁿ), with n ≈ 2.7 and P₅₀ ≈ 26.8 mmHg for adult blood. The curve is flat near the top, so the blood is protected against small drops in oxygen tension. It turns steep below about 60 mmHg, and each further mmHg then costs much more saturation.
Arterial oxygen content is CaO₂ = 1.34 · Hb · S + 0.003 · PO₂. At a normal 95 mmHg and a haemoglobin of 15 g/dL, S is 96.8% and CaO₂ is 19.7 mL/dL. An event that drives PO₂ to 50 mmHg drops S to 84.3% and CaO₂ to 17.1 mL/dL, 13% less oxygen in every decilitre of blood delivered to tissue during that window. The flat top of the curve hides mild problems. Obstructive events work on the steep part.
The nose also adds something the mouth does not. Lundberg's group found that the paranasal sinuses produce nitric oxide at very high concentrations, from an NO synthase expressed in the sinus epithelium (PMID 7585069). That NO is carried into the lungs with nasal breathing. In healthy subjects transcutaneous oxygen tension was 10% higher during nasal than oral breathing, and in intubated patients adding their own nasal air raised arterial PO₂ by 18% (PMID 8971255). A person pushed toward mouth breathing by a costly nose gives that up.
Intermittent hypoxia and reactive oxygen species
Repeated drops and recoveries of oxygen are chemically different from a steady low level. During each low, cells stabilise hypoxia-inducible factor 1α, because the prolyl hydroxylases that normally mark it for destruction need molecular oxygen as a substrate. During each recovery, oxygen returns to enzymes primed by the low: NADPH oxidase (NADPH + 2 O₂ → NADP⁺ + 2 O₂•⁻ + H⁺) and xanthine oxidase (hypoxanthine + O₂ → xanthine + O₂•⁻). Superoxide then reacts with nitric oxide to form peroxynitrite, O₂•⁻ + NO• → ONOO⁻, which removes NO that blood vessels need to relax and oxidises proteins and lipids.
Lavie's review of sleep apnoea and intermittent hypoxia describes that increase in reactive oxygen and nitrogen species and its link to cardiovascular and cerebrovascular disease. It also notes that low-level exposure can activate protective responses, so the outcome depends on how often, how deep and how long the cycles run (PMID 25155182). A narrow airway raises the frequency.
Blood pressure, testosterone and growth hormone
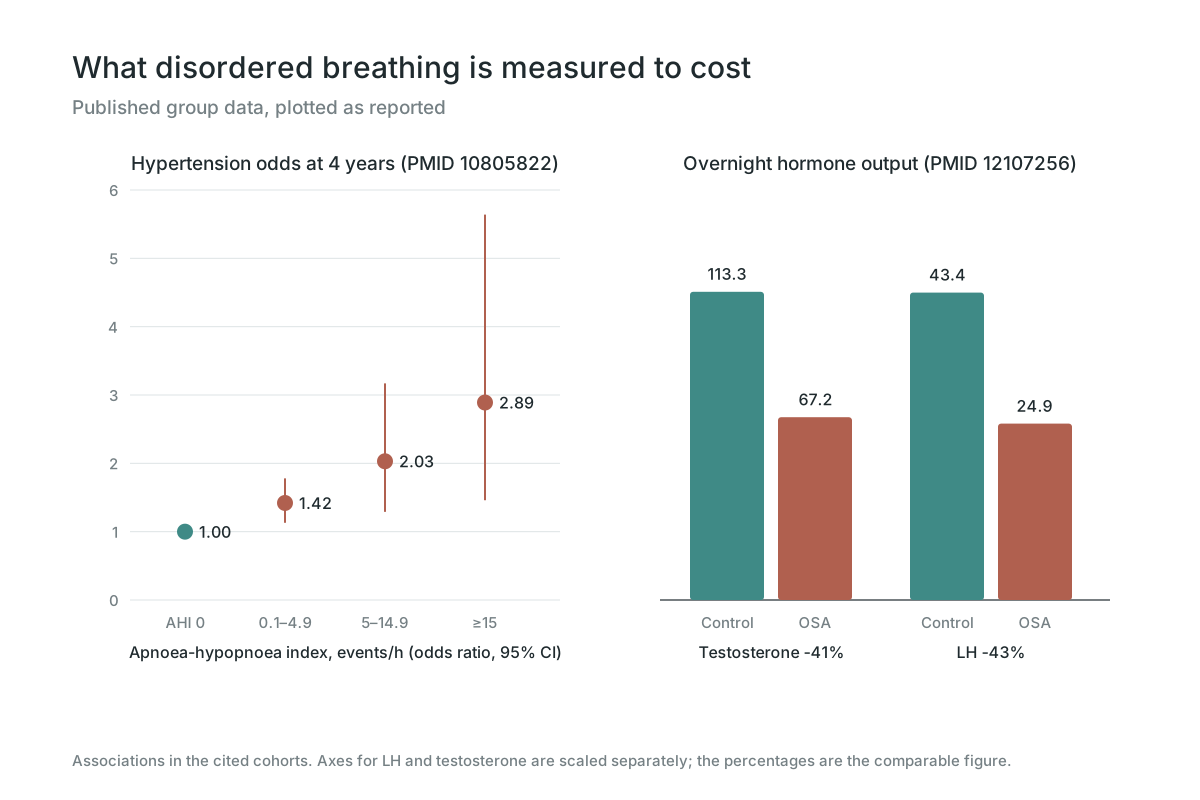
In the Wisconsin Sleep Cohort, 709 adults were studied by polysomnography and followed for four years. After adjusting for baseline blood pressure, body mass index, neck and waist size, age, sex, alcohol and smoking, the odds of hypertension rose with every band of the apnoea-hypopnoea index: 1.42 for 0.1 to 4.9 events per hour, 2.03 for 5 to 14.9, and 2.89 for 15 or more (PMID 10805822). Even the lowest band, below the usual diagnostic threshold, carried higher odds.
Luboshitzky and colleagues sampled blood every 20 minutes through the night. Men with sleep apnoea secreted 67.2 vs 113.3 nmol/L·h of testosterone and 24.9 vs 43.4 IU/L·h of LH, reductions of 41% and 43%. Four of the ten had hypogonadal morning testosterone. The deficit tracked the respiratory disturbance index independently of obesity, but not the depth of hypoxia, which points to sleep fragmentation as the main driver (PMID 12107256). Short sleep alone is enough: one week of sleep restricted to 5 hours lowered daytime testosterone in young healthy men by 10 to 15% (PMID 21632481).
Growth hormone is released mainly in slow wave sleep. Across 149 healthy men, the amount of GH secretion was significantly associated with slow wave sleep independently of age (PMID 10938176). Arousals every couple of minutes interrupt that stage before it deepens.
Children: attention and executive function
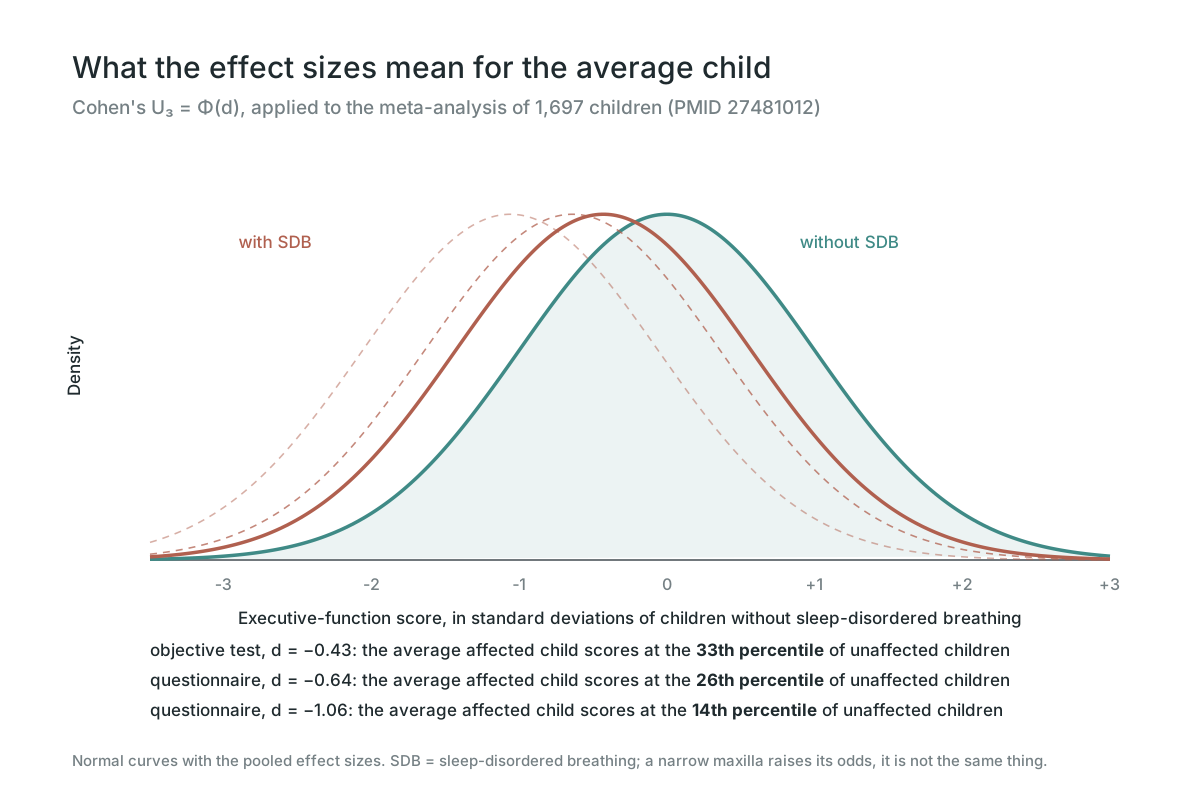
The chain starts early, while the face is still growing. A meta-analysis of 14 studies and 1,697 children aged 5 to 17 found lower objective performance in one executive domain, generativity (effect size −0.43), and medium to large deficits on questionnaire measures of inhibition, working memory and shifting (−0.64 to −1.06) in children with sleep-disordered breathing (PMID 27481012). These are the skills behind planning, self-control and school work.
Narrow maxilla and success: what happens to the average
Success is not one measurement, but its inputs are: attention, working memory, energy, sleep, hormones and staying out of accidents. Each of those is measured to fall along the chain in this article. None of them is destiny for one person. All of them shift the average.
An effect size d says how far the whole distribution moves, in standard deviations. Cohen's U₃ = Φ(d) converts it into a percentile: the share of the unaffected group that the affected group's median scores below. For the executive-function meta-analysis, Φ(−0.43) = 33rd percentile on objective tests, and Φ(−0.64) to Φ(−1.06) = 26th to 14th percentile on parent and teacher ratings. A child who would have been average is moved to where two thirds or more of their peers outperform them.
School results follow. Among 297 first-graders in the lowest 10% of their class, 18.1% had sleep-related gas-exchange abnormalities on overnight oximetry and carbon dioxide recording (PMID 9738185). In working adults referred for sleep studies, those with severe daytime sleepiness (Epworth 18) reported their work output limited 36.0% of the time vs 16.8% for those with little (Epworth 5), and time management limited 38.6% vs 19.7% (PMID 17825611). Drivers with sleep apnoea have a crash-rate ratio that most likely falls between 1.21 and 4.89 (PMID 20465027). Add roughly 40% less overnight testosterone and higher blood pressure odds, and the expected value of a life lived on the narrow side of the curve is lower.
How much a narrow arch changes the odds
Bayes' theorem makes the risk concrete. In Seto's sample, a posterior transverse discrepancy appeared in 20 of 40 patients with sleep apnoea and 1 of 21 controls (PMID 11890066). The positive likelihood ratio is LR⁺ = 0.50 / 0.048 ≈ 10.5. In the Wisconsin cohort, 24% of middle-aged men and 9% of women had an apnoea-hypopnoea index of 5 or more (PMID 8464434).
Posterior odds = prior odds × LR. For a man: 0.24 / 0.76 = 0.32, × 10.5 = 3.3, which is a probability of 77%. For a woman: 0.09 / 0.91 = 0.099, × 10.5 = 1.04, or 51%. Without the discrepancy, LR⁻ = 0.50 / 0.952 = 0.53, which lowers a man's figure to 14%. The controls were selected non-snorers and the sample is small, so the true ratio is lower than 10.5; the arithmetic shows how strongly arch width moves the odds, not an exact personal risk.
Does a birth chart shape the maxilla? The maths
Astrology holds that the positions of the Sun, Moon and planets at the moment of birth shape the body and the life that follows. If that were true for the face, something physical would have to carry the effect from the planet to the palate. At these distances the only candidate is gravity, and gravity can be calculated exactly.
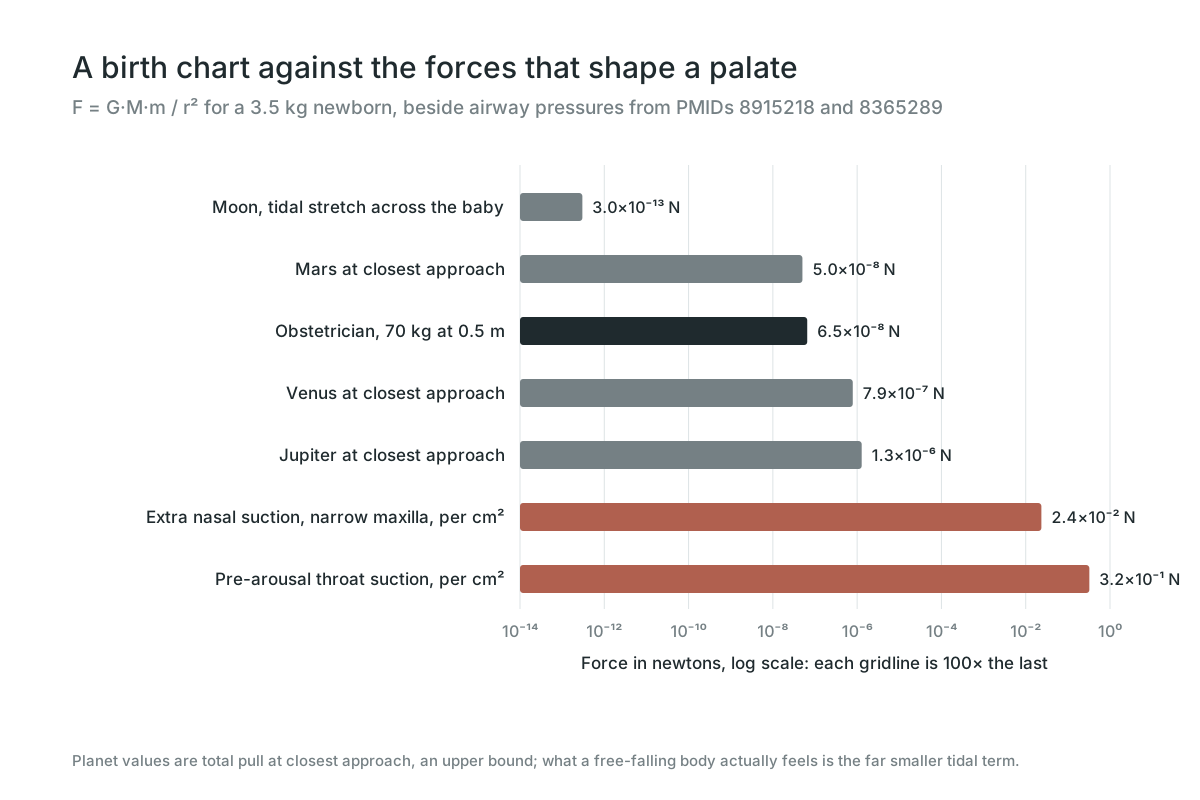
Newton's law gives F = G·M·m / r², with G = 6.674×10⁻¹¹ N·m²/kg². For a 3.5 kg newborn, Mars at its closest approach (6.42×10²³ kg at 5.46×10¹⁰ m) pulls with 5.0×10⁻⁸ N. The obstetrician, 70 kg at half a metre, pulls with 6.5×10⁻⁸ N, more than Mars. Venus at its closest gives 7.9×10⁻⁷ N and Jupiter 1.3×10⁻⁶ N. Even those are upper bounds. Mother, baby and Earth all fall toward a planet together, so the only force that can deform a body is the tidal difference across it, ΔF ≈ 2·G·M·m·d / r³. For the Moon across a 0.5 m baby, that is 3×10⁻¹³ N.
Compare the forces that actually load a palate. The extra suction a narrow nose demands, 2.4 cmH₂O, is 235 Pa, or 2.4×10⁻² N on every square centimetre of throat wall. It arrives about 6,720 times a night. That is roughly 470,000 times Mars's pull and 18,000 times Jupiter's, on each square centimetre, on every breath. The suction before an arousal, 33 cmH₂O, is 0.32 N per square centimetre. Tongue pressure, chewing load and the direction of breathing are larger again, and they act for hours a day through the whole of growth.
The conclusion is numerical, not a matter of belief. The sky at birth delivers forces four to eleven orders of magnitude smaller than a single breath through a narrow nose. If a birth-month pattern in jaw width were ever found, the maths says to look at what changes with the season on the ground, such as infections, allergies and nasal blockage, not at what is overhead.
Narrow vs wide maxilla, side by side
Each row follows one step of the chain above. The wide column is the reference the studies compared against.
| Measure | Narrow maxilla | Wide maxilla |
|---|---|---|
| Arch form | Narrower, more tapered, shorter | Broad, rounded, coordinated with the lower arch |
| Nasal floor | Narrower lower nasal airway | Wider lower nasal airway |
| Nasal resistance | 7.7 cmH₂O/L/s in constricted maxillae | 2.9 cmH₂O/L/s in controls |
| Suction per breath at 0.5 L/s | 3.85 cmH₂O | 1.45 cmH₂O |
| Tongue space | Tongue sits lower and farther back | Tongue can rest up in the palate |
| Breathing route | Pressure toward mouth breathing | Nasal breathing with sinus NO |
| Sleep | More flow limitation and arousals | Fewer resistance-driven arousals |
| Average child, executive function | 14th to 33rd percentile | 50th percentile |
What the evidence does and does not show
These are associations measured in groups. A narrow maxilla raises the odds along each step; it does not guarantee sleep apnoea, and sleep apnoea has other causes, including body weight, neck size and lower-jaw position. In 164 Japanese men with sleep apnoea, a narrower upper arch went with more severe disease, but the patients' arches were not narrower than the Japanese standard as a group; the narrowing that mattered was linked to a lower jaw set back relative to the upper (PMID 23956331). The Marfan data come from a syndrome with unusually marked constriction.
The Poiseuille, work and Hill calculations are models built on the measured numbers. They show why the effects are nonlinear and how large they can be; they are not measurements of any one person.
Frequently Asked Questions
Environment during growth: mouth breathing, prolonged pacifier or digit habits, short or absent breastfeeding and soft food with little chewing load. Nasal obstruction alone reshaped the face in primates (PMID 6939331), and soft diets narrowed the arch in rats and minipigs (PMID 11803645, PMID 9224944).